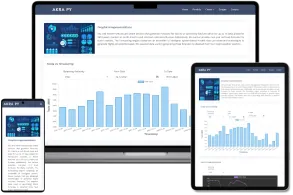

Data Visualization (Tableau)

We have created various visualizations using dashboard views for any kind of data representation, through the use of tableau for analytical reporting.
We have created a visualisation for E-commerce stores, offline stores and many more. Finally, we deliver clean data in the client’s preferred format.
We have data visualization expertise to present data in a beautiful and eye-catchy way, and also make it understandable for all viewers.
Now, data can be ingested, analyzed, and translated into a visual representation to make data interpretation easier and more accessible to key players in an organization. Here we have discussed Visual Analytics key concepts.
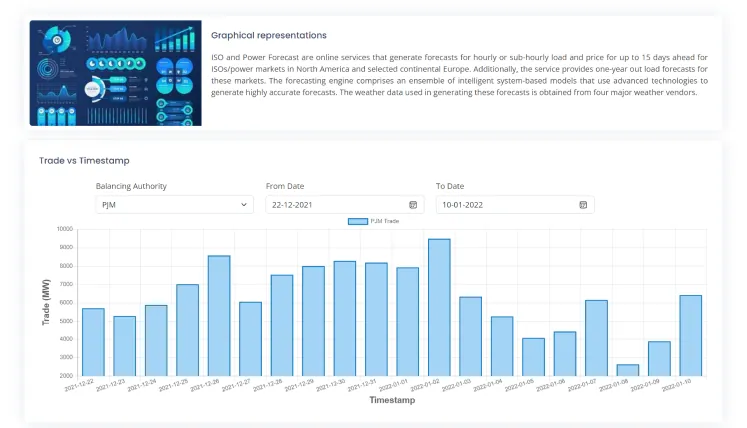
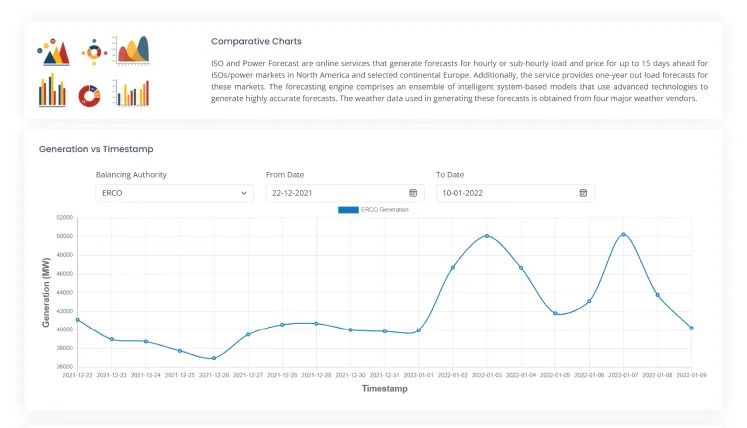
We have provided insight into solving a problem is displayed in an interactive, graphical manner.Our Visual Analytics can be perceived as an integrated approach that combines visualization, human factors, and data analysis.
For example, the dashboard screens would have different types of engines involving visual graphs, pie charts or infographics tools, where, after computational algorithms work, the results are displayed on the screen.
Our Visual Analytics interface makes it easy for a human user to understand the results, and also make changes simultaneously that further directs the computer’s algorithmic process.
Our innovative idea of visual analytics has been the combination of raw algorithmic strength and adept visualization, each one strengthens the work of the other in refining data sets for various goals and objectives.
We offer Tableau services to help easy-to-use drag and drop interface that can help you quickly turn your data into business insights. The online and server versions allow your entire team to build and work with the visualization tool.
We also connect to local or remote data of many different formats, connect to live data for up-to-date visualizations
We have prepared Wireframes and Front end design using Adobe XD, Photoshop in coming up with the initial design and mockup and followed by further design revisions
- Design graphic user interface elements, like menus and tabs
- Illustrate design ideas using storyboards, process flows
- Built page elements such custom graphics and illustrations
- Developed UI mockups and prototypes that clearly illustrate how sites function and look like
- Layout adjustments based on user feedback
Our Development Team came up with the technical architecture followed by data flow design, process flow design, flow charts, and technical documentation
We used PHP Tech Stack with Application Programming Interfaces (APIs) which let “Plug in” to other Useful Features. Through our highly skilled and certified developers, we developed custom solutions and technical services on a wide range of requirements and thereby exceeding the client’s expectations. This has all been achieved through our efficient coding best practices, development processes, implementation guidelines, technical maturity & end to end delivery.
We performed a comprehensive test strategy since technology stack undergo constant changes due to upgrades in web and mobile technologies. Our testing included exhaustive functional and non-functional testing, manual and automation testing besides performance and security testing. Our automated Application Testing and Performance Analysis ensured testing the applications on multiple devices and form factors and make the testing process quick, efficient, reliable, repeatable and reusable.
Our comprehensive application testing coverage included the following:
- Functional testing including UI testing for native, hybrid and web applications
- Cross Browser Testing across various browser platforms
- Cross platform testing: iOS, Android, Windows, BlackBerry and HTML5
- Non-functional testing: Performance, stability, security and compliance
- Usability and compatibility testing
Unlock the Power of Data with Visual Analytics
Transform raw numbers into meaningful stories. Our Tableau-powered dashboards help you visualize trends, identify opportunities, and make data-driven decisions—faster and smarter.