Introduction
Grafana is a database analysis and monitoring tool. It allows you to create dashboard visualizations of key metrics that are important to you. Grafana has a thriving community of enthusiasts who share reusable dashboards,Grafana supports a huge number of data sources. And, since the application is open source, you can be sure that the moment a new data source has been released, someone out there is adding support for it. The most common use case of Grafana is displaying time series data, such as memory or CPU over time, alongside the current usage data.
Installing Grafana Locally
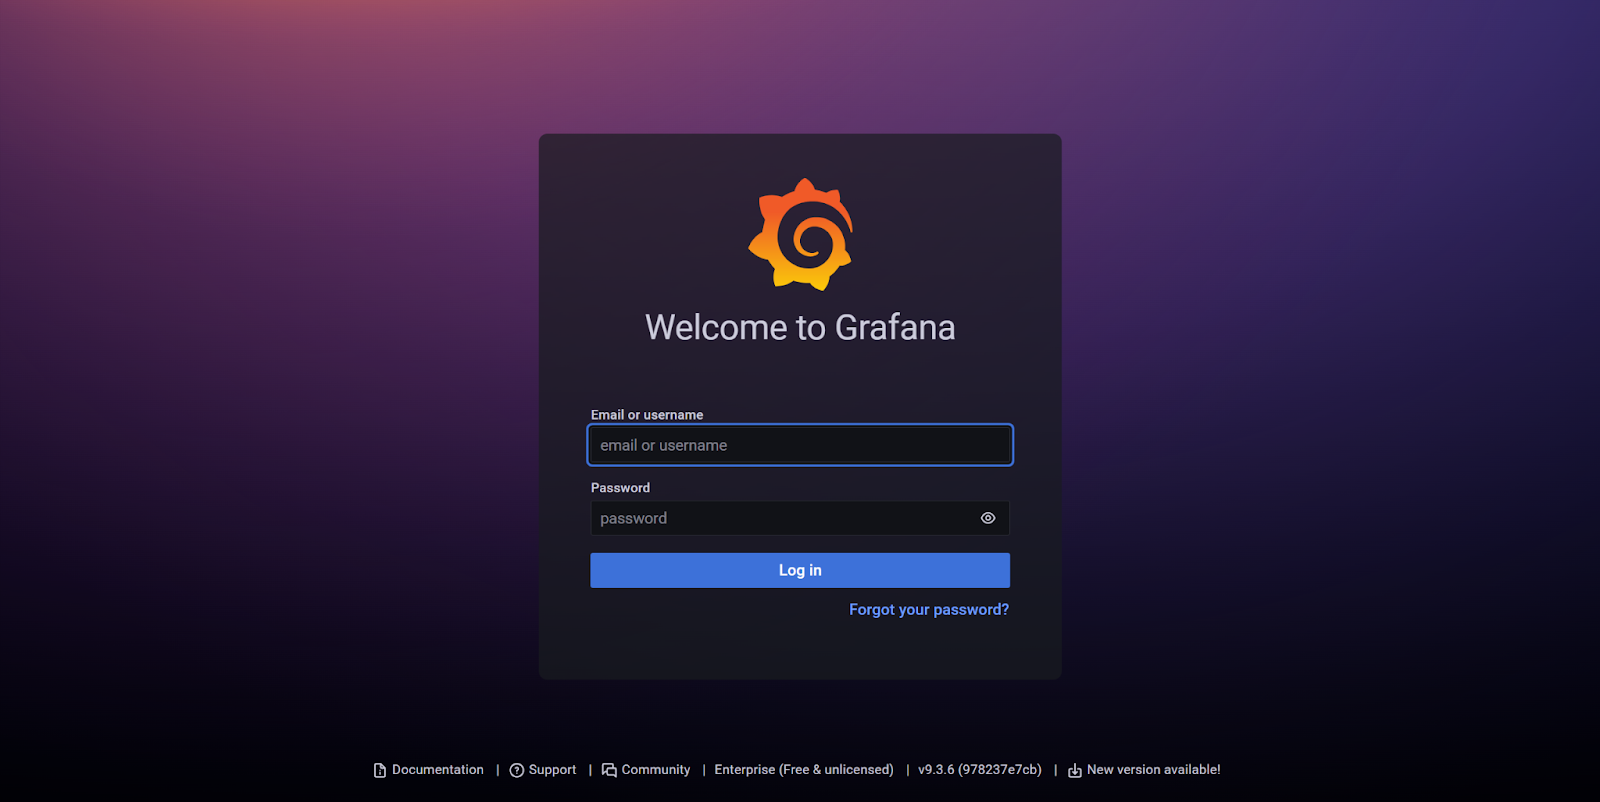
Grafana provides comprehensive instructions for wherever you want to deploy it.If the installation was a success, then Grafana should be available through your web browser by default on http://localhost:3000, and your screen should look like the image below. The default username is admin and the default password is also admin. You will be asked to change your password after logging in.
Configuring DataSource:
Configuring your data source is the first step to setting up your Grafana dashboard, Grafana supports different storage backends which provides a variety of ways to query and visualise the data. All of these data sources expose their own query languages. For example, Prometheus exposes PromQL for time series data, and MySQL data source exposes SQL query language. Now let’s add Prometheus as the data source in Grafana.
Go to configuration → data sources and click on “Add data source”.
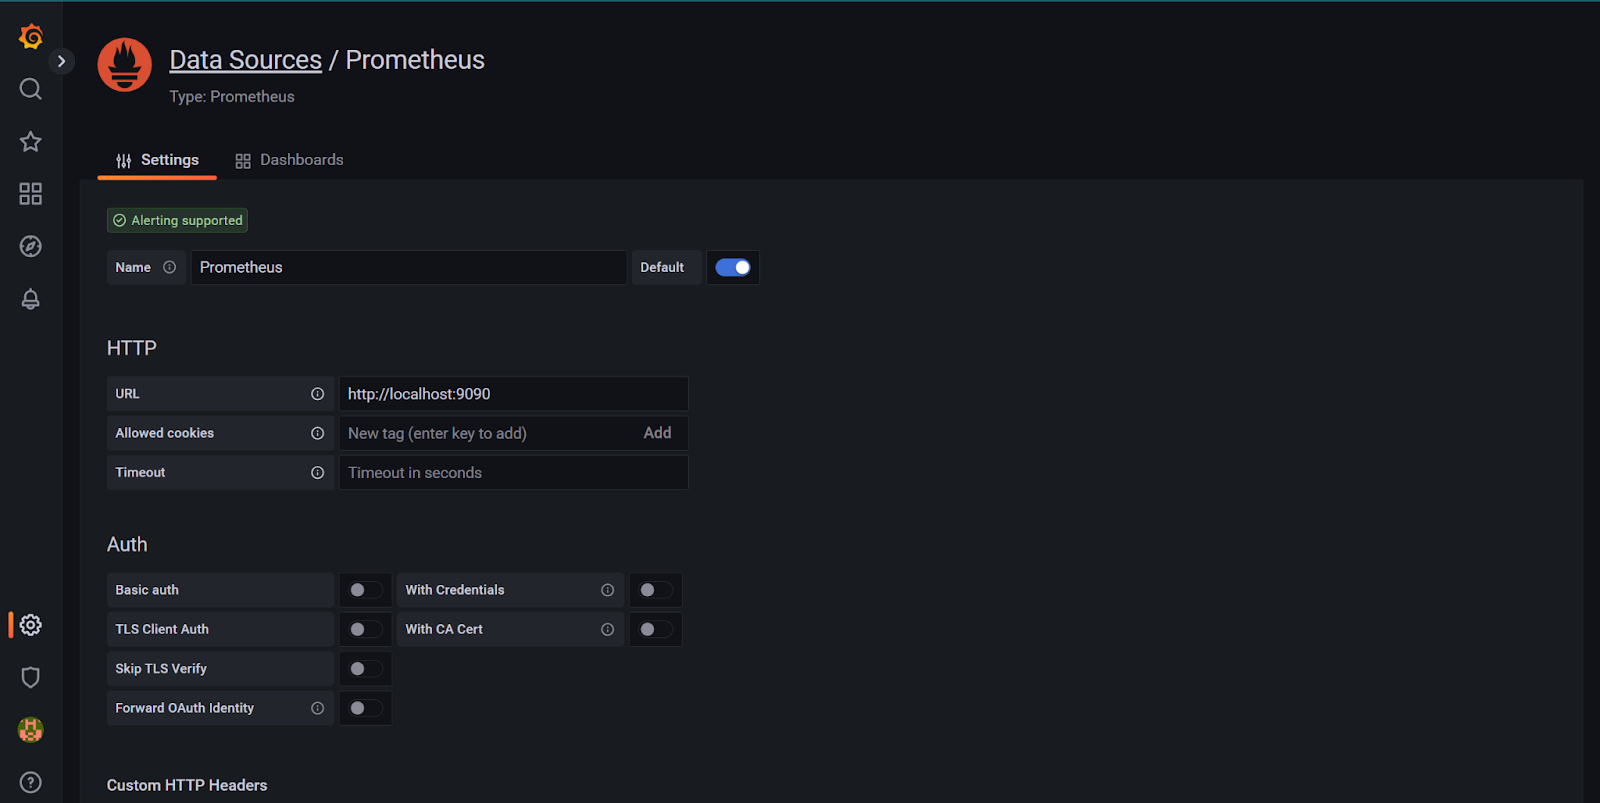
Add Prometheus and fill out the URL, authentication, scrape interval, and name of the data source. Press save and test. It should show Data source is working if Grafana successfully connects to Prometheus.
Need help in building dashboards with Grafana? We’re here to help. Book a call now!
Build Your dashboard with grafana Now
We are here to customize your immediate needs and launch your product on time within the defined budget.
Please share your requirement and get ready to see how AKRATECH can build your MVP in no time.


Create Dashboards
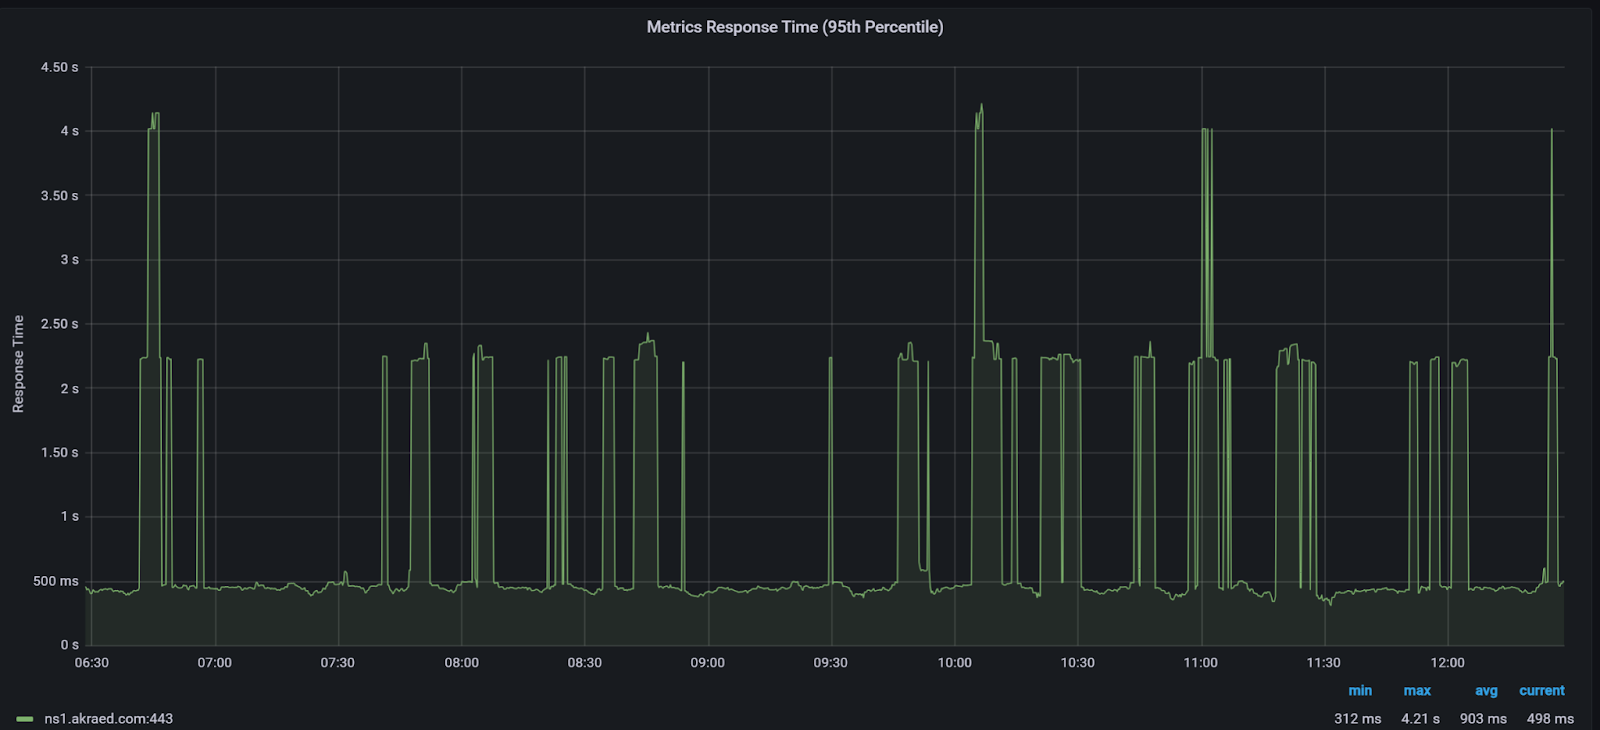
Dashboards are made from panels of information organised into rows. I’m creating a dashboard from one datasource, but you can use different data from different sources in the same dashboard.Panels represent a visual representation of a query. Each panel can show the same or different data using a visualisation that is the easiest for you to process.
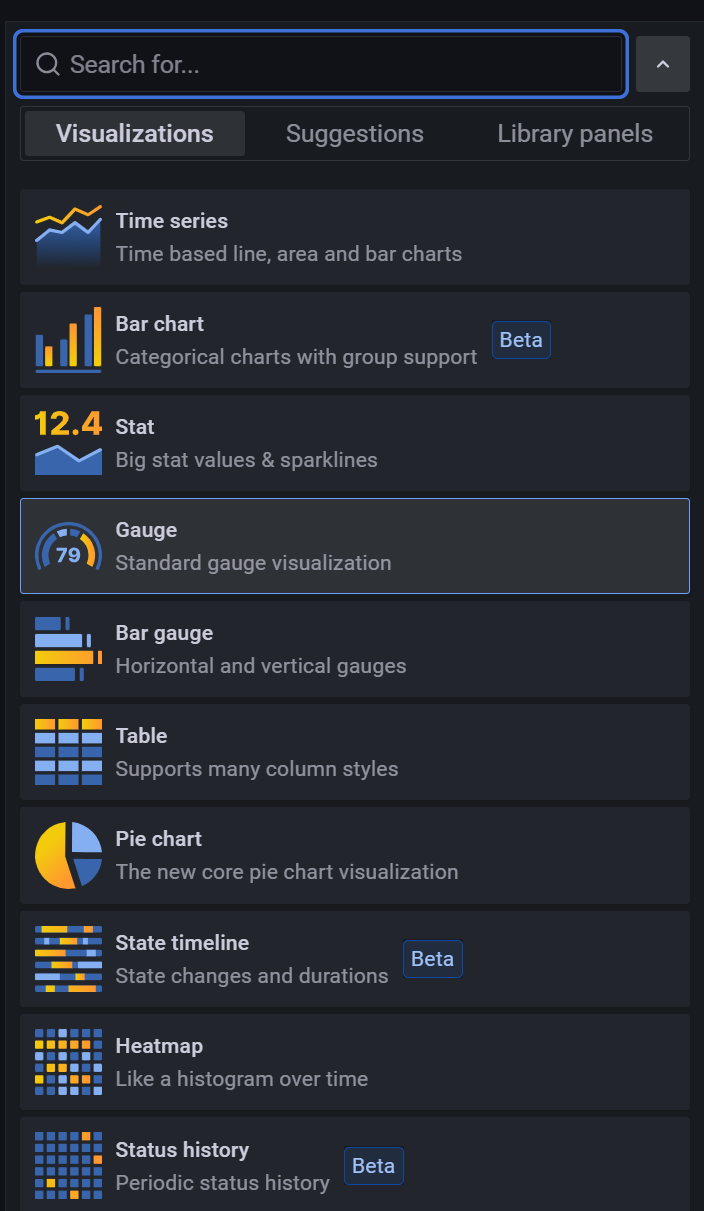
On the right hand side on the panel tab expand the Visualization menu and choose the stat icon. This will immediately give you a preview of your panel showing the dashboard.
Grafana calculates how long the time intervals are in each graph automatically. It uses the variables $_interval, $_from, and $_to. For example, if you are viewing the last 6 months of data it will show 1-day interval segments in the graph, whereas if you are viewing the last 1 hour’s data it will show in 1-m interval groups.
Intervals and refresh
Grafana provides time intervals so we can check metrics at a given point in time or over a time interval. In the top right corner, you can see the drop-down menu where you can set the time interval for the data. There are a couple of usual ones like last 5 m, last 1 hour, last 12 hours, and custom time intervals for any date or time, Auto refresh can be used to refresh data in specific time intervals like every 5 s, every 1 m, etc.
Dashboard import and export
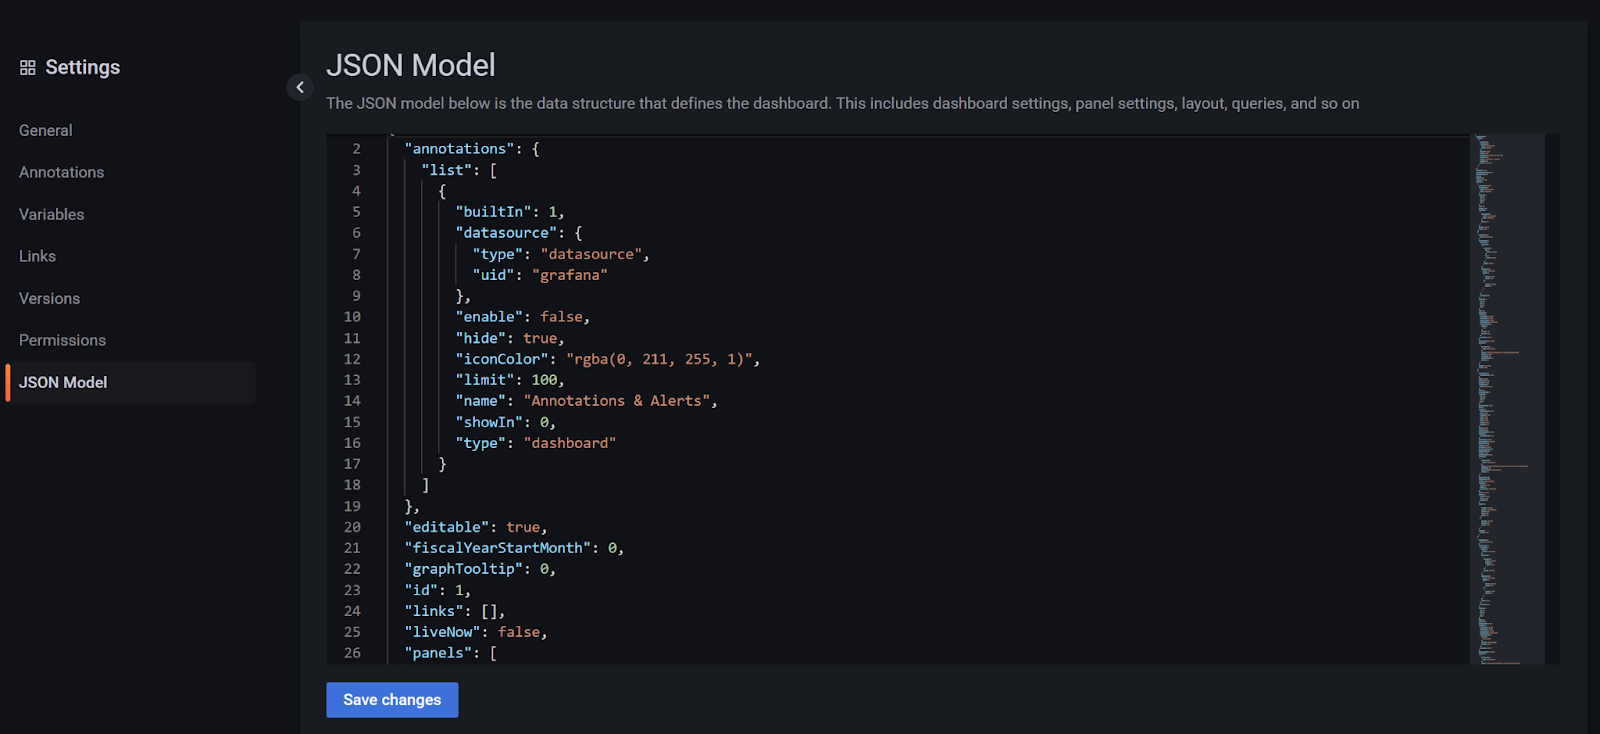
Every dashboard in Grafana is JSON-based. These dashboards can be exported from a JSON file or Grafana’s dashboard repository.
Let’s export the dashboard we just created. Go to dashboard setting → JSON Model, shows a JSON document. This JSON document is a complete dashboard definition that can be imported to any other Grafana instance. Let’s save it as node-exporter.json.
Conclusion:
In this Grafana tutorial, you learned how to set up your first dashboard, Grafana is not just for when you have performance issues. You can proactively set up alerts to notify you when a value reaches a threshold to keep one step ahead of your performance issues. The dashboard looks so good that you’ll soon be putting monitors with all your dashboards up all over the office. It can become an obsession!