DATA ANALYTICS & VISUALIZATION SOLUTIONS
Our data visualization experts and professionals will assist you with leveraging actionable insights from multiple sources and transform them into interactive visualizations, allowing you to track goals and results, uncover opportunities, estimate demand, and more.
Get a 45-minute FREE consultation for your Data Analytics & Visualization Projects with our experts!
Data Analytics Solution Consultant
We help our clients translate observations into shared knowledge and use patterns, trends, and data to create bullet-proof strategies. Leverage our expertise in data visualization solutions to solve core business problems operating with algorithmic complexity.
Akratech helps organizations use raw data to build predictive algorithms and use heuristics. Our quantitative technique in finding solutions to many business problems involves building analytic models.
Our data analytics & visualization professionals carry rich experience in Predictive Modeling, Structural Equation Modeling, Survey designing, Digital Mapping, Data mining, Regression Analysis (Linear to non-linear), Statistical Analysis Interpretations, and Hypothesis Testing or Estimation.

Data Exploration Analysis and Insight
Akratech’s data visualization experts can help you in mining data insight and building data products while expressing textures, dimensions, and correlations in data that can be expressed mathematically.
Our data analytics and visualization professionals use classical and Bayesian statistics, inferential techniques, and strategic machine learning algorithms along with their creativity and ingenuity to build robust solutions and find clever solutions to problems.
We conduct data visualization using Tableau and help you conduct detailed analysis and extract useful insights from source data.
Advanced Algorithms Machine Learning

We consider ourselves algorithmic thinkers with the ability to break down complicated problems and recompose them in ways that are solvable. We have a strong mental comprehension of high-dimensional data, tricky data control flow pieces, and putting pieces together to build a cohesive solution.
Our rich experience in SQL, Python, R, and SAS. On the periphery are Java, Scala, and Julia have helped us to prototype quick solutions, as well as integrate with complex data systems.

Data Product Engineering
Our experience in building data products revolves around processing data to algorithmically-generated results.
Akratech’s data engineers deep dive in at a granular level to mine data and understand complex behaviors, trends, and inferences. It’s about surfacing hidden insights that can help enable companies to make smarter business decisions.
Our mature experience in analytical creativity helps us to investigate leads, and try to understand patterns or characteristics within the data using quantitative techniques in order to get a level deeper – e.g. inferential models, segmentation analysis, time series forecasting, and synthetic control experiments.
Our Computational Competency in Data Visualization

![]() Experience in Python / R Language
Experience in Python / R Language
![]() Data scraping and API Design
Data scraping and API Design
![]() Data normalization and distribution
Data normalization and distribution
![]() Knowledge of probability and statistics.
Knowledge of probability and statistics.
![]() Experience in Data visualization and related tools.
Experience in Data visualization and related tools.
![]() Experimental design and adaptive experimentation methods.
Experimental design and adaptive experimentation methods.
![]() Data collection and cleaning
Data collection and cleaning
![]() Relational database management with SQL or NoSQL document database topology
Relational database management with SQL or NoSQL document database topology
![]() Applied Mathematics – Linear Algebra and Calculus
Applied Mathematics – Linear Algebra and Calculus
![]() Algorithms and data structures – Sorting, Trees, Graphs, and Data Topology Design
Algorithms and data structures – Sorting, Trees, Graphs, and Data Topology Design
Data Visualization Services we Provide
Business Intelligence Solutions
Akratech offers end-to-end Business Intelligence solutions through which we help companies integrate data from multiple reliable sources. Our experts also help you extract useful insights and patterns from this data using advanced analytics methods. We cover all your needs when it comes to data warehousing, business analytics, and data quality management.
Data Engineering Solutions
Leverage Akratech’s extensive experience in high-performance infrastructure for your data and optimize it in a way that helps you make better decisions. Our exhaustive data engineering services include data discovery and maturity assessment, real-time data processing, batch processing, cloud-centric solutions for high data volumes, advanced data analytics, and data optimization.
Cloud Platform Analytics
Akratech’s cloud experts help you set up and implement cloud platform analytics for your business. Leverage our 360-degree expertise in cloud and analytics for deriving the most value for faster goal achievement for your organization.
Data Science Solutions
Akratech’s data science specialists offer extensive data science solutions, Our data visualization team is always updated on the latest data science trends and provides top-notch services like data integration, data modeling, data design, and more.
Big Data Services
Ensure the seamless functioning of your data systems and big data analysis and processing with Akratech. We are a big data consulting service company that can also help you with architectural design and software development. We are a big data consulting service company that can also help you with architectural design and software development and big data testing services.
TOOLS WE USE
Business Intelligence
![]() Power BI
Power BI
![]() Tableau
Tableau
![]() Microsoft Business Intelligence
Microsoft Business Intelligence
Data Science
![]() Tensor Flow
Tensor Flow
![]() Python
Python
![]() RASA
RASA
![]() Azure Machine Learning
Azure Machine Learning
![]() R
R
Big Data Analytics
![]() Apache Spark
Apache Spark
![]() Apache Zookeeper
Apache Zookeeper
![]() Amazon Redshift
Amazon Redshift
![]() Kafka
Kafka
Making Enterprises Stand Out With intelligent Data Analytic Websites that Matter.
Discover how we capture intelligent data and display it with beautiful dashboards for your websites!
Have a Data Analytics Project in Mind?
DATA VISUALIZATION SOLUTIONS
The power of Data visualization
Data Visualization is nothing but the presentation of data in a pictorial or graphical style. It allows decision-makers to see analytics visually portrayed, allowing them to acquire difficult ideas or uncover new trends. Data visualization tools, which include visual components such as charts, graphs, and maps, make it easy to view and comprehend trends, outliers, and patterns in data.
Why Choose Us?
Our data visualization services entail creating pixel-perfect reports and interactive dashboards based on your business requirements. Our professionals will assist you with transforming data from many sources into interactive visualizations, allowing you to track goals and results, uncover opportunities, estimate demand, and more. We also provide self-service reports to lessen your reliance on IT or MIS employees.
We follow a client-first approach, meaning all your business goals and requirements are taken note of and prioritized during the entire time of our collaboration. Akratech’s data visualization and analytics professionals are also always available to resolve all your queries and issues at any point of time.

Our Data Visualization Services
![]() Dashboard Optimization: BI Dashboards combine engaging, actionable graphics with built-in performance architecture to deliver insights on mobile and web devices. This procedure can shorten load times and improve engagement.
Dashboard Optimization: BI Dashboards combine engaging, actionable graphics with built-in performance architecture to deliver insights on mobile and web devices. This procedure can shorten load times and improve engagement.
![]() Data Preparation: Data preparation is a common method of preparing data sets for use in business intelligence (BI) and analytics applications. It gathers, cleans, and unifies raw data in order to provide considerable economic value.
Data Preparation: Data preparation is a common method of preparing data sets for use in business intelligence (BI) and analytics applications. It gathers, cleans, and unifies raw data in order to provide considerable economic value.
![]() Data Platform Development: A data platform is a service that collects, stores, and analyses data. Creating a data platform results in the creation of a centralized service that includes business intelligence tools, a data warehouse, and a set of data science and analytical environments.
Data Platform Development: A data platform is a service that collects, stores, and analyses data. Creating a data platform results in the creation of a centralized service that includes business intelligence tools, a data warehouse, and a set of data science and analytical environments.
![]() Dashboard Development: Data visualization can help you improve your business intelligence and analytics. We create complete data dashboards and reports for a wide spectrum of corporate users, from data analysts to non-analytic users.
Dashboard Development: Data visualization can help you improve your business intelligence and analytics. We create complete data dashboards and reports for a wide spectrum of corporate users, from data analysts to non-analytic users.
Our Recent Experience in Data Visualization
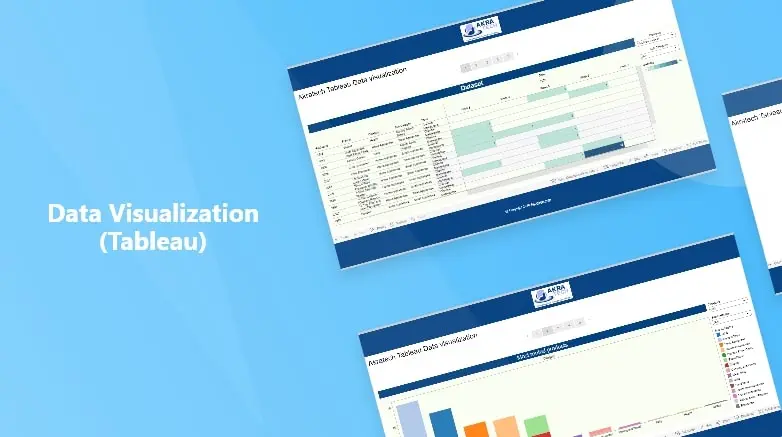
![]() Data Visualization through Tableau: We have created various visualizations using dashboard views for any kind of data representation, through the use of Tableau for analytical reporting. We have created a visualization for E-commerce stores, offline stores, and many more. Finally, we deliver clean data in the client’s preferred format.
Data Visualization through Tableau: We have created various visualizations using dashboard views for any kind of data representation, through the use of Tableau for analytical reporting. We have created a visualization for E-commerce stores, offline stores, and many more. Finally, we deliver clean data in the client’s preferred format.
Our Visual Analytics interface makes it easy for a human user to understand the results, and also make changes simultaneously that further direct the computer’s algorithmic process.
We have provided you insight into solving a problem displayed in an interactive, graphical manner. Our Visual Analytics can be perceived as an integrated approach that combines visualization, human factors, and data analysis.
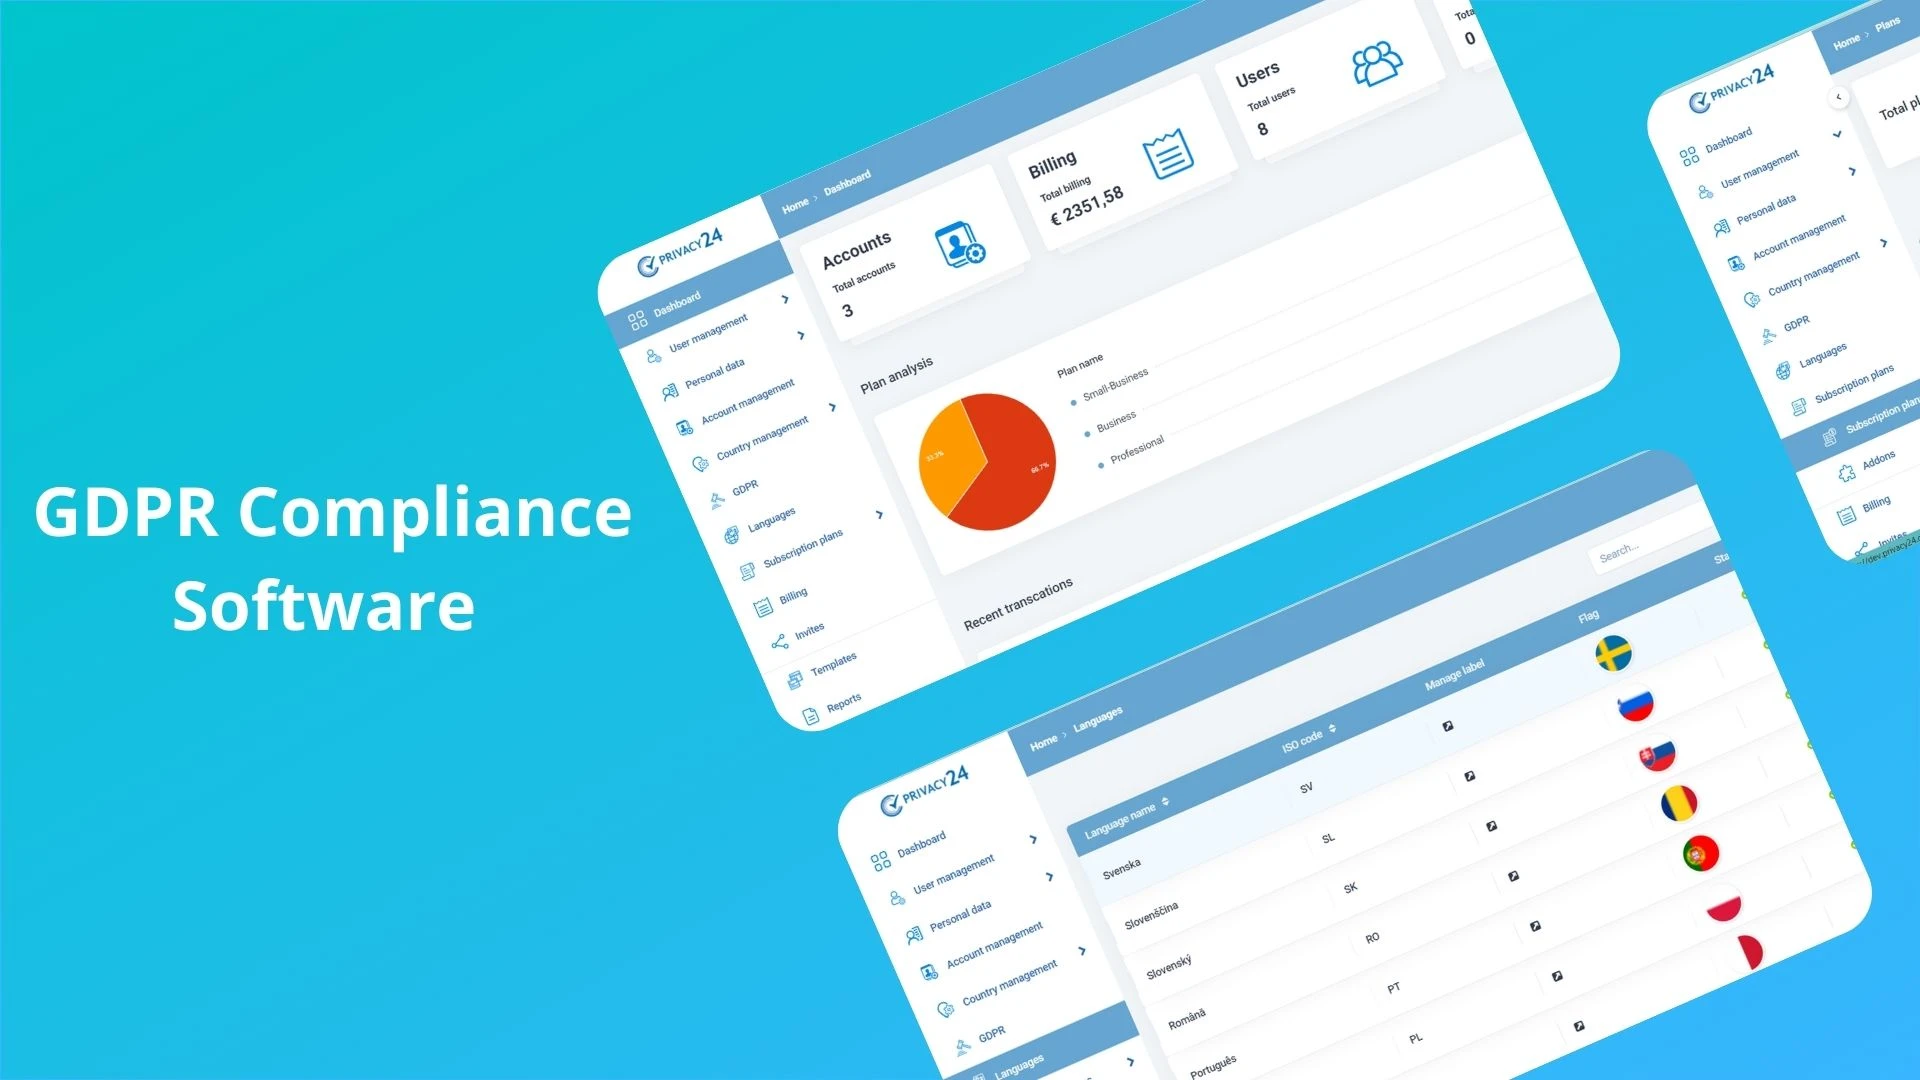
![]() Dashboard and Reporting Tool: As the trend & insights are included in the dashboard, it gives you the ability to make better, well-informed decisions based on both past performance and future prediction of performance. When used in this manner, the dashboard becomes a valuable decision-support tool that is based on business intelligence.
Dashboard and Reporting Tool: As the trend & insights are included in the dashboard, it gives you the ability to make better, well-informed decisions based on both past performance and future prediction of performance. When used in this manner, the dashboard becomes a valuable decision-support tool that is based on business intelligence.
Our reporting tools provide status to top management on a regular basis, both in informal and more formal reviews. The performance indicator can be used by the managers to summarize the overall status based on input and discussion with the team. There is a direct correlation between the summary status report and the performance indicator.
![]() Inventory Forecasting with Tableau: We have built an inventory forecasting tool with the help of Python and Tableau to create a dashboard view in the application which displays the forecasting information. This helps in the analysis and forecast of the future requirement of products for any store. Our dependable and efficient forecasting tool provides an analytical approach to your team members for making business decisions faster and with precision.
Inventory Forecasting with Tableau: We have built an inventory forecasting tool with the help of Python and Tableau to create a dashboard view in the application which displays the forecasting information. This helps in the analysis and forecast of the future requirement of products for any store. Our dependable and efficient forecasting tool provides an analytical approach to your team members for making business decisions faster and with precision.
Data visualization allows us to create custom dashboards to track all key product/store metrics and that provide ongoing alerts when metrics fall below a certain threshold.
Data Visualization Techniques
![]() Line Chart
Line Chart
![]() Scatter Plot
Scatter Plot
![]() Heat MAP
Heat MAP
![]() Matrix
Matrix
![]() Connectivity Chart
Connectivity Chart
![]() Bar Chart
Bar Chart
![]() Pie Chart.
Pie Chart.
![]() Funnel Chart
Funnel Chart
![]() Symbol Map
Symbol Map

Data Visualization tools